Understanding results
The results page personalises your outcome with a severity indicator per ear, an audiogram chart, and a frequency-band interpretation describing what any hearing loss feels like in daily life.
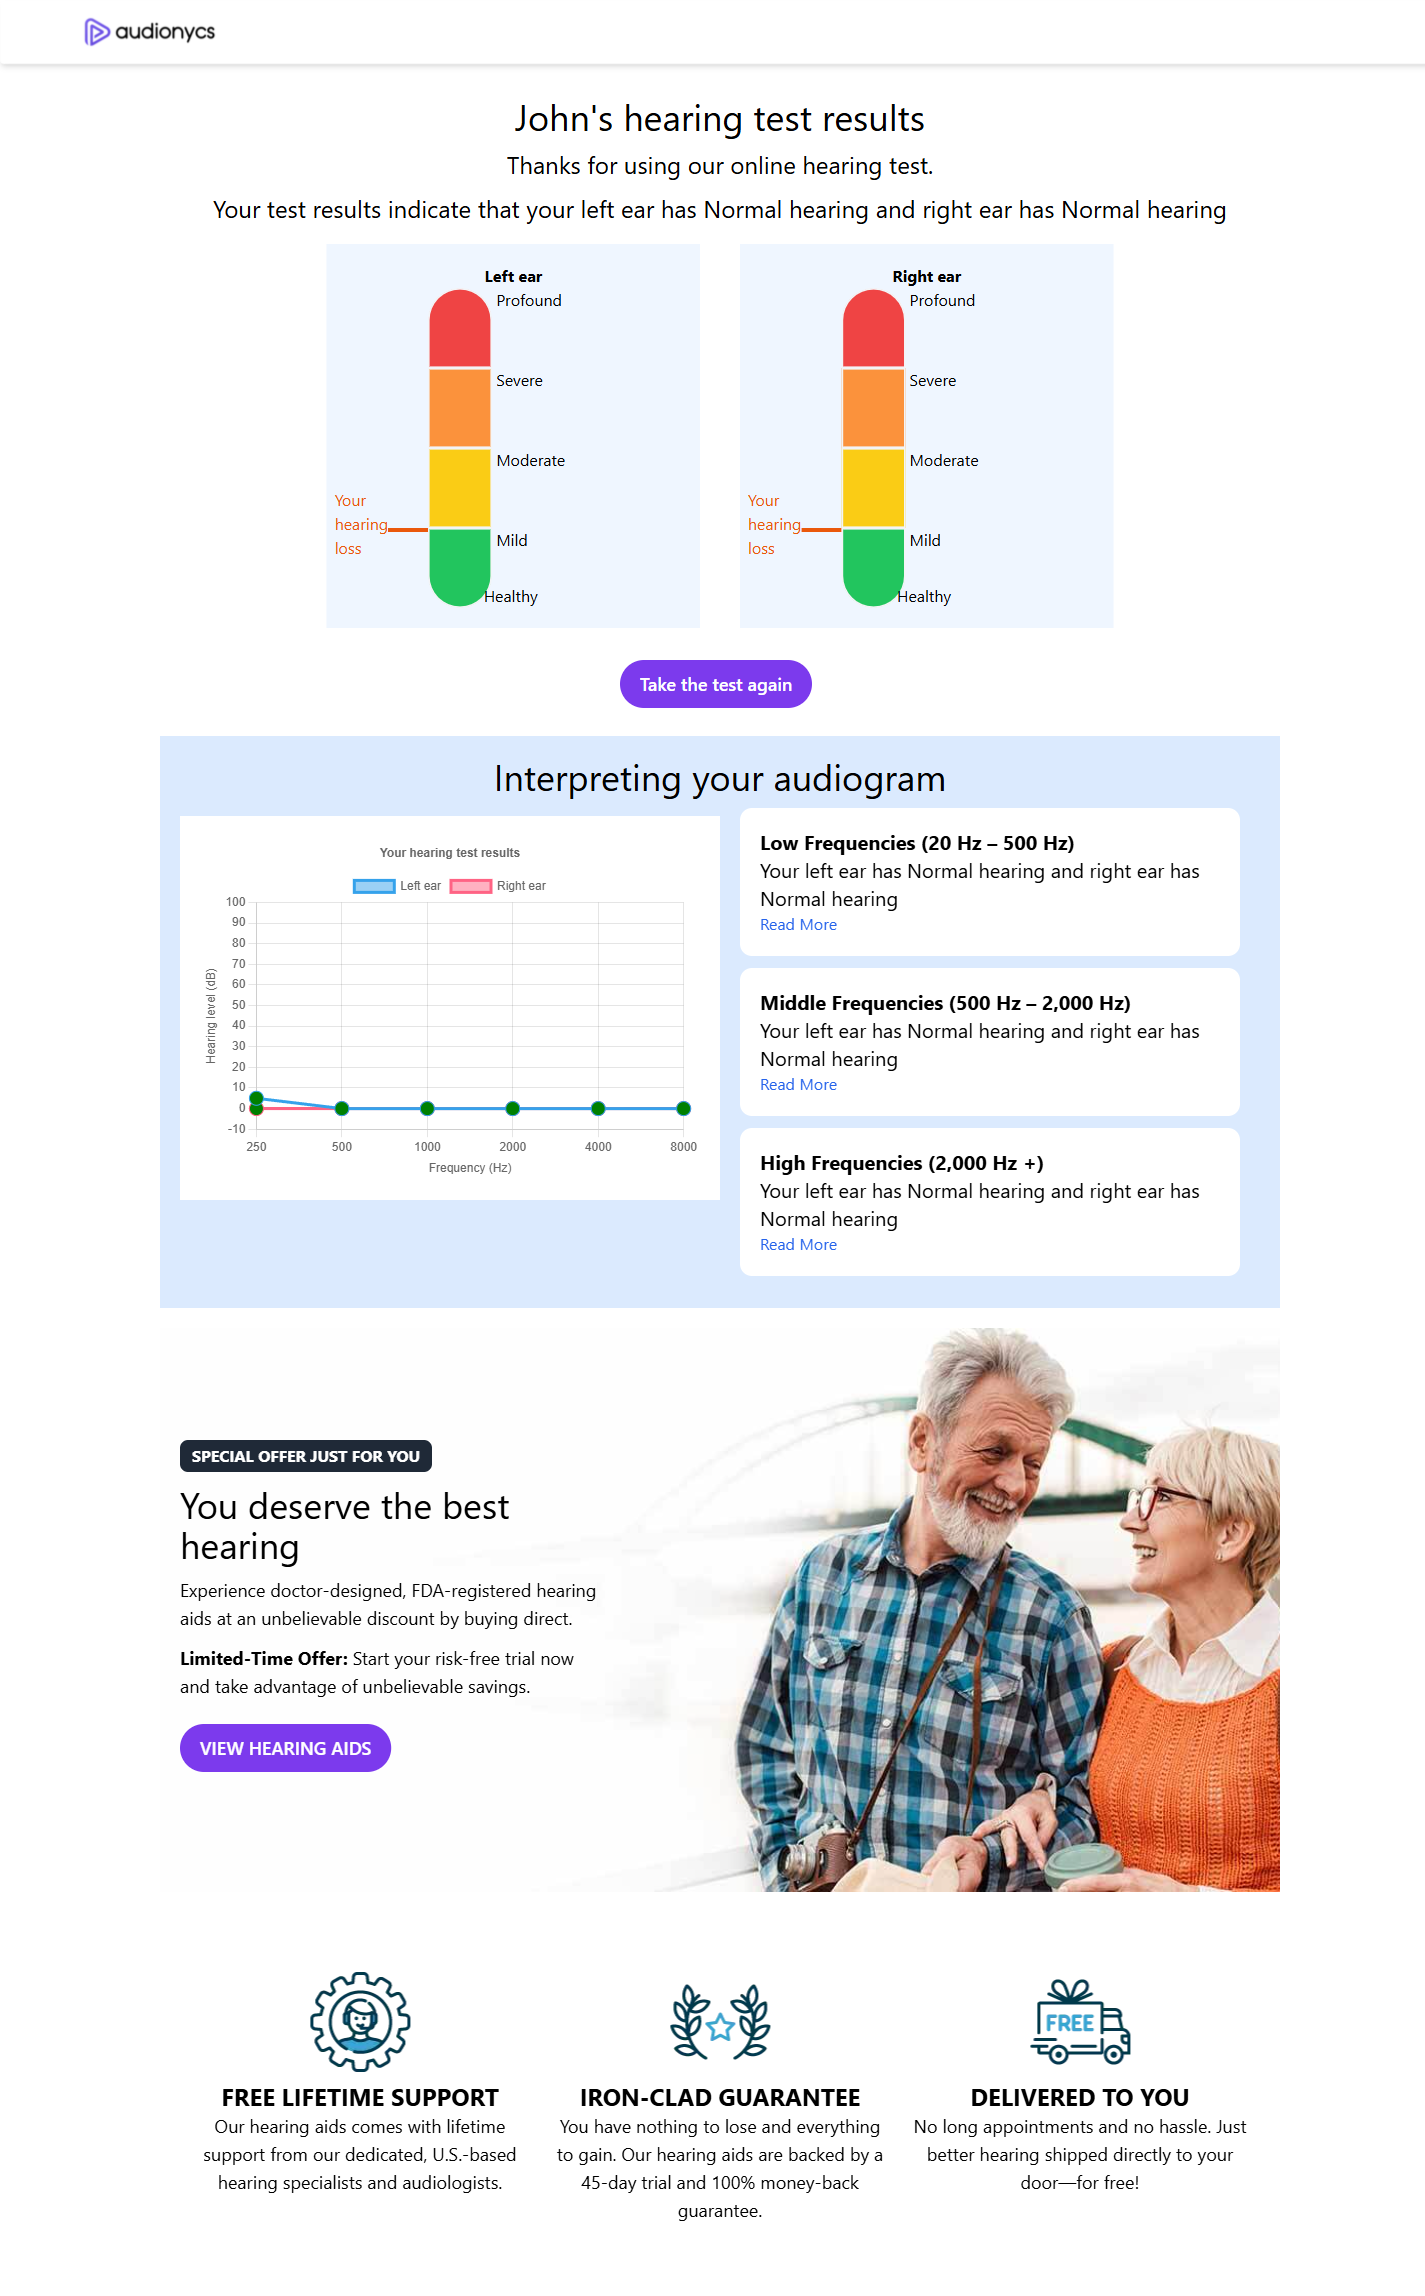
Results page: severity bars, audiogram, and interpretation.
Severity scale
Each ear is placed on a five-level severity bar, with a "Your hearing loss" marker highlighting the level your average threshold falls into. The colour-coded bands run from healthy (green) at the bottom to profound loss (red) at the top.
| Label | Meaning |
|---|---|
| Healthy | Normal hearing across the tested frequencies. |
| Mild | Mild loss — soft speech may be difficult to follow. |
| Moderate | Moderate loss — normal conversation is hard without focus. |
| Severe | Severe loss — only loud speech is audible. |
| Profound | Profound loss — hearing aids are typically recommended. |
The audiogram
The audiogram inside the Interpreting your audiogram panel plots hearing threshold (in decibels, dB) against frequency (in Hertz, Hz) for both ears. Lower on the chart means the sound had to be louder before you could hear it, so points near the top represent good hearing and points near the bottom represent poorer hearing.
- Blue line — Left ear.
- Pink line — Right ear.
- The x-axis runs through the six measured frequencies (250, 500, 1000, 2000, 4000 and 8000 Hz) and the y-axis runs from -10 dB up to 100 dB.
Frequency-band interpretation
Beside the chart, the report splits your audiogram into three bands and describes the real-world impact of any loss in each.
20–500 Hz
Male voices, deep tones, thunder, dogs barking, distant rumbles.
500–2,000 Hz
Typical conversation, phone calls, TV dialogue, everyday sounds.
2,000 Hz +
"s", "f", "th" consonants, women's and children's voices, birdsong, whispers.
Tap Read More under any band to expand a longer explanation of what loss in that range typically feels like in daily life.
Retaking the test
A Take the test again button sits directly below the severity bars. Use it if you want to redo the measurement — for example after switching headphones or moving to a quieter room.
Below the audiogram, the results page features a "Special offer" panel promoting Audionycs' doctor-designed, FDA-registered hearing aids with a 45-day risk-free trial and lifetime support. This section is informational — you can ignore it if you are not interested.
What if the result seems off?
Online tests are screening tools, not diagnostic devices. Retake the test in a quieter room or with better headphones if the result surprises you. If you suspect a real hearing issue, book an appointment with an ENT specialist or audiologist — they can run a full clinical evaluation.